 button on the Window toolbar or pressing the F2 function
key.
button on the Window toolbar or pressing the F2 function
key.The Window toolbar (See Graphic Display for more information) offers some common graphical plotting
choices, but these are just a few of the options available. Many more options
are located in the Model Display Options dialog which may be accessed by clicking
the button on the Window toolbar or pressing the F2 function
key.
The options are organized into groups of items. Access each group by clicking on the tabs along the top of the dialog box. Some of the options are mutually exclusive and others are conditional. Typically, only one option in a vertical row may be chosen at a time and indented options will not be applied if the heading option is not also applied.
Each of the groups presents the option to turn off those particular items in the view. This is not the same as unselecting the items. Turning items on and off is independent from selecting and unselecting. For example if you make a selection of members and then turn off members all together, the selection still stands for any modification applied to members.
Each of the Model Display Options dialog tabs is described in its own section:
You may make any Plot Option settings the default start-up settings. To do this, go through all the Model Display Options tabs and set all the options to what you want as the start-up default. Once that is done, select the Misc tab and press the button labeled Make Current Plot Settings the Default.
Note:
Access the graphical options for joints
by clicking the Model Display Options button on the Window
toolbar and selecting the Joints tab shown below.
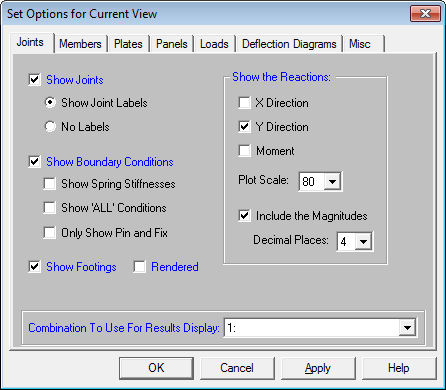
You may specify that Joints are, or are not, displayed and you may include the joint label.
You may display Boundary Conditions and as part of this option you may display any spring stiffnesses that you have specified. The “All” boundary condition will not be shown unless it is also specified.
If a single or a batch solution has been performed you may choose to show the Reactions in any of the three degrees of freedom and include the magnitudes. For Batch solutions you must choose which combination you want to view.
Access the graphical Model Display Options for members
by clicking the Model Display Options button on the Window
toolbar and selecting the Members tab shown below.
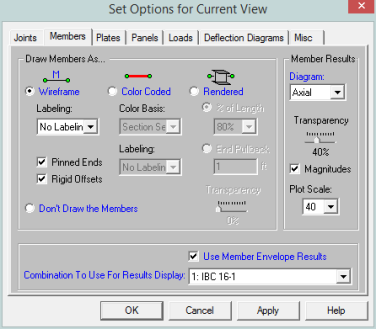
You may specify that no members are drawn, or you may draw them as Wireframe, Color Coded, or Rendered.
With the Wireframe and Color-Coded options you may include textual member information alongside each member. The Labeling drop down list provides the choices you have as to what information will be displayed alongside each member. The Wireframe option also allows you to display member Pinned End conditions and/or either Rigid End Offsets.
Color-Coding of members plots the members using various colors to represent particular information such as the section set assigned to each member, stress levels, etc. The Color Basis drop down list provides the choices you have as to how the colors are to be assigned to each member. If a single or batch solution has been performed you may color the members by the code check or the stress magnitudes. For batch solutions you must choose which combination you want to view. The key that defines these colors is shown in the upper right corner of the model view.
Note
The Rendering option will produce true-to-scale renderings of the members. These may be rendered full length or pulled back by a specified distance or a percentage of the member length for a better understanding of complicated intersection areas and a better view of the member cross-section. This option is also very useful for verifying member orientations.
If the model has been solved you may also plot the member force Diagrams along each member and include the Magnitudes. You can also control the graphic scaling of these force diagrams. The diagrams themselves may be presented with varying degrees of Transparency with 100% transparency meaning an outline of the force diagram and 0% indicating a solid fill. If a batch solution has been performed you may also choose which combination you want to view.
Access the graphical Model Display Options for button on the Window toolbar and
selecting the Plates tab shown below.
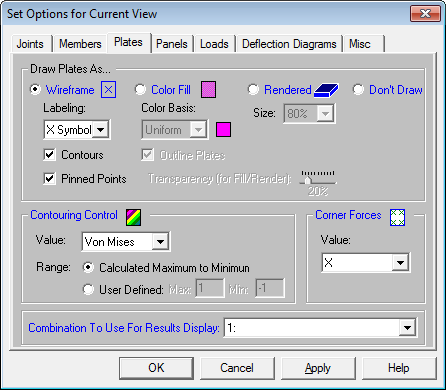
The Draw Plates As... section of this tab allows you to specify
that
When the Wireframe option is selected,
you may include information on the
When the Color Filled option is selected,
Note:
The Color Contours are plotted with a global smoothing algorithm that allows the contour to vary across the plates. Because of this, the plotted contour results will differ slightly from the tabulated results in the spreadsheets. This effect will be heightened in regions of a high rate of change such as loads or boundaries. The contours may be drawn as either lines or as color filled areas.
The Contouring
Control section determines what force or stress result is to be contoured
and how the contour colors are to be assigned. The Value drop down
list is where you select the specific result to be contoured (
When the Rendered option
is selected, true to scale representations of the
Along with any
of the above options you may also plot the plate Corner Forces.
These are the global direction forces applied to the corners of the plates that hold them in equilibrium. The Value drop down list is
used to pick which corner force (or moment) is to be displayed.
The Transparency setting described above for Color Filled plates also applies to Rendered plates.
Access the graphical Model Display Options for panels by clicking the Model Display Options button on the Window toolbar and selecting the Panels tab shown below.
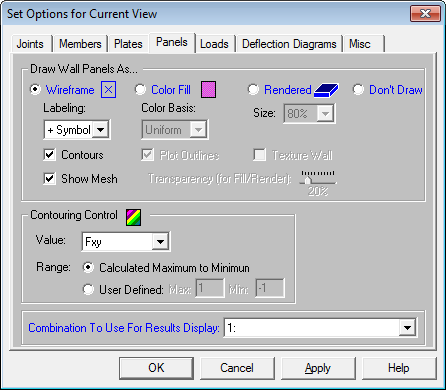
The Panels section of this tab allows you to specify that panels are to be drawn as wireframe, color filled, or rendered elements, or that they are not to be shown at all.
When the Wireframe option is selected, you may include information on the panels when plotted. The Labeling drop down list provides the choices you have as to what information will be displayed on each panel, such as the panel label, material, or the panel number. If a single or batch solution has been performed, the wireframe option also allows for the display of line contours representing the force or stress results for the panels. Each color line represents a specific value. For batch solutions you must choose which load combination you want to view in the Combination To Use For Results Display drop down list. You also have the option to see the mesh that the program automatically creates internally for all Wall Panels.
When the Show Mesh option is selected, panels are plotted showing the internal plate mesh automatically generated during a solution. This is useful for verifying and understanding how the forces/stresses are distributed within a panel.
When the Color Filled option is selected, panels are plotted with different colors that are mapped in a key shown in the upper right corner of the model view. You may color the panels by material set or specify a uniform color for all panels. If a single or batch solution has been performed then you also have the option to plot the stress and force results using filled color contours where each fill color represents a range of values. The color filled panels themselves may be presented with varying Transparency with 100% transparency meaning completely see-through and 0% indicating completely solid. For batch solutions you must choose which combination you want to view.
Note:
The Color Contours are plotted with a global smoothing algorithm that allows the contour to vary across the panels. Because of this, the plotted contour results will differ slightly from the tabulated results in the spreadsheets. This effect will be heightened in regions of a high rate of change such as loads or boundaries. The contours may be drawn as either lines or as color filled areas.
The Contouring Control section determines what force or stress result is to be contoured and how the contour colors are to be assigned. The Value drop down list is where you select the specific result to be contoured (Qx, Fx, Mx, Von Mises, etc.). The Range controls determine how the contour colors are assigned. You can either contour the full range of the results by choosing Calculated Maximum to Minimum, or, if you are only interested in a specific range of values, you can choose User Defined and enter your own max and min values.
When the Rendered option is selected, true to scale representations of the panels will be drawn with thickness. You may also display the rendered panels at a percentage of their size. This is useful in understanding orientation and connectivity.
Access the graphical Model Display Options for loads by clicking the Model Display Options button on the Window toolbar and selecting the Loads
tab shown below.
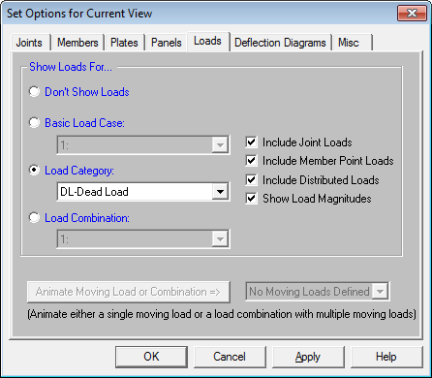
You may specify that the loads be drawn as Load Cases, Load Categories or Load Combinations by selecting the corresponding radio button. The load types to be displayed can be selected by checking the corresponding boxes.
Once you set the Model Display Options for loads, you may then run through
all of the load cases, load categories
or load combinations by choosing them from the drop down list 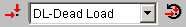 on the Window
toolbar.
on the Window
toolbar.
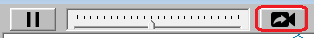
You may also animate any Moving Loads by selecting them from the drop-down list and then clicking on the Animate button. This will produce an animation in a new model view window. Use the arrow buttons or slider bar to adjust the speed of the animation. You may pause the animation and use the step number entry to jump to a particular time step.
In the model view of the moving loads, the Capture feature allows users to save video file format of the moving loads. To use this feature, adjust to the desired number of frames and click on the video button. The user will be prompted to save the video file.
Access the Model Display Options for deflections
by clicking the Model Display Options button on the Window
toolbar and selecting the Deflection Diagrams tab shown below.
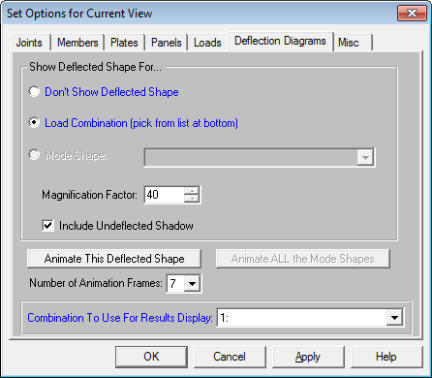
In the Show Deflected Shape For... section of the tab you may specify that a deflected shape
be drawn in the current model view based on
To animate a particular deflected shape, first select the deflected shape (as described above) and then simply click the Animate This Deflected Shape button. A new model view will be created with the animation. The Number of Animation Frames drop down list allows you to specify how many frames are used in the animation to move from the undeflected state of the model to the fully deflected state.
In the model view of the animated deflected shape, the Capture feature allows users to save video file format of the animated deflected shape. To use this feature, adjust to the desired number of frames and click on the video button. The user will be prompted to save the video file.
Note:
For additional advice on this topic, please see the RISA Tips & Tricks webpage at risa.com/post/support. Type in Search keywords: Deflected.
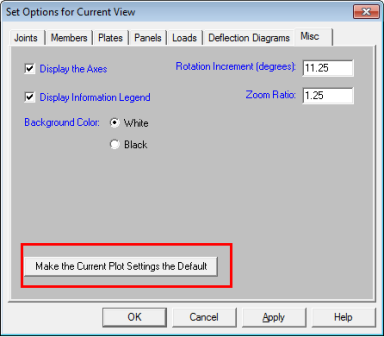
Access miscellaneous plotting options by clicking the Model Display Options button on the Window toolbar and selecting the Misc
tab shown below.
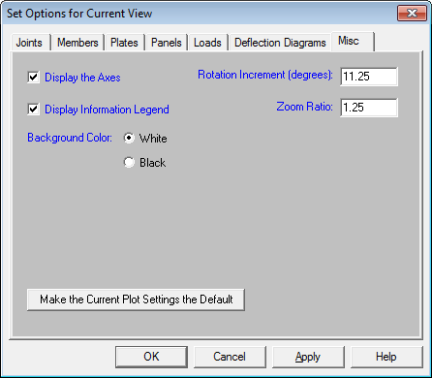
You may indicate whether the global axes icon is to be displayed in the upper left corner of the model view by checking the Display the Axes box. You also have the option of displaying the informational legend drawn in the bottom left corner of the model view by checking the Display Information Legend box. This legend has information such as which combination has been solved, which loads are being displayed, etc.
You may specify whether the Background Color for the model view is to be black or white by clicking the corresponding radial button. A black background shows colors more vividly, but a white background shows a more realistic representation of what you'll get if you print the graphic view.
By entering values in the text boxes, you may control the Rotation Increment and Zoom Ratio that will be used with each click of the corresponding toolbar buttons on the Window Toolbar.
Finally, you may make any plot option settings the default startup settings. To do this, go through all the Model Display Options tabs and set all the options to what you want as the startup default. Once that is done, press the Make Current Plot Settings the Default button. This button applies to ALL the Model Display Options tabs.